
A project schedule network diagram is used for pictorial representation of logical relationships among the project activities. They are drawn to depict project dependencies or relationships between two activities and/or milestones. They are also called logical network diagrams.
There are three ways to draw a project network diagram. These are:
- Precedence Diagramming Method (PDM): This is also called as Activity on Node (AON) method and it is most popular way of making network diagrams.
- Arrow Diagramming Method (ADM): This is also called as Activity on Arrow (AOA) method. It is a defunct way of making network diagrams as it has some limitations.
- Conditional Diagramming Methods: These too are not generally used.
Out of the above methods, only PDM is used nowadays. It is used by most of the modern software scheduling tools and is described in the PMBOK Guide.
Let us understand PDM by looking at some pictures and examples.
Project Schedule Network Diagram: Example & Diagram
The main principles of PDM technique are:
- Activities are represented in a box
- Milestones are represented in a circle
- Dependencies are represented by arrows
- Activities/milestones are separated by arrows
- Arrow head depicts successor activity/milestone
- Arrow tail depicts predecessor activity/milestone
- Multiple arrows can originate from an activity/milestone depicting that there is more than one successor.
- Multiple arrows can terminate in an activity/milestone depicting that there is more than one predecessor.
Note: An activity ‘Y’ is said to be dependent on another activity ‘X’ if Y requires an input from X. You can read my other articles on project dependencies and four types of dependencies in project management to understand more about the dependencies.
The figure drawn below depicts a sample project network diagram that is drawn using PDM technique.
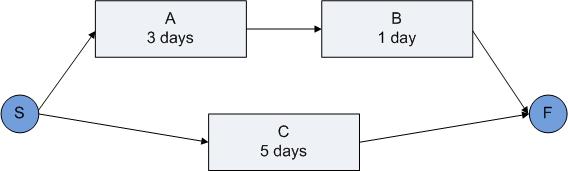
In the above figure:
- There are 3 activities viz. A, B and C.
- A, B and C have a duration of 3 days, 1 day, and 5 days respectively.
- Planned duration of each activity is mentioned in its respective node.
- There are 2 Milestones viz. S and F.
- S and F are Start and Finish milestone respectively.
- A has only 1 Predecessor – Milestone S
- A has only 1 Successor – Activity B
- B has only 1 Predecessor – Activity A
- B has only 1 Successor – Milestone F
- C is neither related to A nor to B
- C has only 1 Predecessor – Milestone S
- C has only 1 Successor – Milestone F
You can read my article on critical path analysis to understand how to prepare and solve a network diagram.
Benefits of Network Diagram in Project Management
A network diagram is a graphical representation of the project schedule.
A picture is worth thousand words, which is evident from the above example. A network diagram allows the project team to understand the state of each activity quickly. Its benefits include:
- It establishes project workflows.
- It provides visual representation project schedule to the stakeholders.
- It helps in tracking dependencies and potential bottlenecks.
Studies prove that visual depiction of data can improve comprehension and enhance retention. It essentially means that meaning that a network diagram can enhance productivity while lowering the stress among project team members.
Precedence Diagramming Method (PDM)
In Precedence diagramming method, activities (or milestones) are drawn on a node and the arrows connecting the nodes depict the relationship between activities. Following are are some key points about PDM.
Activity – It is a small part of work in a project. It is represented on a Node and is usually drawn as a rectangle.
Milestone – It is a zero duration activity, which requires no work. A project can have start and finish milestones as well as intermediate milestones. It is also represented on a Node and is usually drawn as a small circle.
Predecessor Activity/Milestone – It is simply called as a Predecessor. A Predecessor logically comes before the dependent activity/milestone.
Successor Activity/Milestone – It is simply called as a Successor. A Successor is the dependent activity/milestone. It logically comes after Predecessor(s).
Node – All the activities/milestones (Predecessors and Successors) in a Project Network Diagram are drawn on a Node.
Arrow – Dependencies between activities/milestones are represented by arrows. Two related nodes are separated by a unidirectional arrow. Predecessors are shown towards the arrow tail while successors are shown towards the arrow head.
Sub-network – It is simply called as a subnet. It is a subdivision or a part of a complete Project Network Diagram.
Dependencies – A Successor (dependent node) can have more than one predecessors. Similarly a predecessor can have more than one successors.
4 Types of Logical/Project Relationships in PDM
To understand the logical relationships between two activities, we should look at each activity as a set of two distinct events. These are:
- Start Event (S)
- Finish Event (F)
So, for two related activities, we will have two sets of S and F events respectively. For these two sets, we can have four type of logical relationship between them.
PDM includes 4 types of logical relationships between two dependent activities/milestones. These are:
- FS Relationship – Start Event of a Successor is dependent Finish event of Predecessor. You can refer to Finish-to-Start (FS) Relationship to understand it thoroughly.
- SS Relationship – Start Event of a Successor is dependent Start event of Predecessor. You can refer to Start-to-Start (SS) to understand it thoroughly.
- FF Relationship – Finish Event of a Successor is dependent Finish event of Predecessor. You can refer to Finish-to-Finish (FF) Relationship to understand it thoroughly.
- SF Relationship – Finish Event of a Successor is dependent Start event of Predecessor. You can refer to Start-to-Finish (SF) Relationship to understand it thoroughly.
In all the above relationships, Predecessor’s event is written first and Successor’s event is written later e.g. FS means Finish of Predecessor and Start of Successor.
Note: Since milestones have zero duration, their Start and Finish events are same.
2 Types of Modifiers in PDM
PDM supports two Modifiers, which can applied to each relationship. These are:
- Lead
- Lag
These Modifiers do not change the nature of a logical relationship. They just change the Start and Finish events of the dependent activities. A lead accelerates the Successor activity whereas a Lag delays it. You can refer to my other articles on Project Shcedule Lead and Lag and FAQ on Lead and Lag to understand them completely.
Final Thoughts
Project Network diagram is one of the many ways to represent project schedule. It is the most powerful way to analyze logical relationships between different activities and milestones. Some of the other popular methods to represent the project schedule are:
- Bar Charts (popularly known as Gantt Charts)
- Milestone Charts
- Project Calendars
Over To You
Do you use network diagrams while making project schedule? How do you use them? What other alternative methods do you use for making your project schedules?
I would love to hear from you.


Hi Praveen
Thank you the series of introductory articles. Though these concepts form part of the project management domain, but also relates to programming workflow engines.
I came across your site after having heard about “start-to-start”, “start-to-finish”, etc. and it’s interesting how this relates to concurrency in general as well how this would fit in to programming the front-end and back-end of the engine we are working on.
Thanks again!
Thanks Ockert