You might be looking to understand the usage of variance and standard deviation in PERT formula.
PERT is an acronym for Program Evaluation and Review technique. This technique is used to determine duration and cost estimates of a task. In this technique, a weighted average (mean) of three different estimates is used to determine the final estimate.
The weighted average in PERT is based on an approximate formula derived from a statistical distribution technique called Beta Distribution. Let’s understand how we can apply standard deviation on the PERT formula.
You should read my other article on three point estimation techniques before reading further. It will help you to understand the fundamentals of PERT formula and Beta Distribution.
PERT and Standard Deviation Formulas
Let us use the same example from the above mentioned article and apply PERT formula.
In that example, we wanted to find out the time required to go from point A to point B with the following three values:
- Optimistic value (O) = 45 minutes
- Pessimistic value (P) = 225 minutes
- Most Likely value (M) = 90 minutes
PERT Formula
Let’s apply the PERT formula on the above values.
E_PERT=(O+P+4×M)/6
E_PERT=(45+225+4×90)/6
E_PERT=105 minutes
It means that there is a fair chance (Central Value) of completing the task (going from point A to point B) in 105 minutes.
Standard Deviation Formula
The Standard Deviation for PERT can be calculated by using the following formula:
σ = (P – O)/6
For our example, Standard Deviation come out to be:
σ = (225 – 45)/6
σ = 30 minutes
So, the formula suggests that there could be 30 minutes Variation (Deviation) from the Mean. I will elaborate it further in the next section.
Variance Formula
The Variance for PERT can be calculated by using the following formula:
Var = SQR(σ)
For our example, Standard Deviation come out to be:
Var = SQR(30)
Var = 900
Variance does not have much significance for a single task but it becomes extremely useful while calculating duration of a sequence of tasks. You can refer to my article on how to use PERT and CPM together to understand it further.
Importance of Standard Deviation in PERT Estimation
Standard Deviation is an important concept in Statistics. It is based on probability principles. Let us start with a small example to understand what probability is and how it is used in project management.
Statistical Probability and Project Management
Let’s answer this question, “What is the chance of getting a ‘Heads’ in a toss of a coin?”
You would say that’s easy. There is a 50% chance of getting a Heads. Or you might say the probability of getting ‘Heads’ is 50% or 1/2.
Let’s answer another question, “What is the chance of getting a ‘Six’ in a throw of a dice?”
You would think a bit more and then say there is a 1 in 6 chance of getting a ‘Six’. Or you would say probability of getting ‘Six’ is 16.67% or 1/6.
Those were easy questions but how would you respond to the following question?
In the example from previous section, what is the Probability of reaching point B in 105 minutes?
We can use Standard Deviation formula to answer this question. Let’s understand how.
Statistical Mean and Standard Deviation
In Statistics, Mean and Standard Deviation have a special significance. The Mean is calculated on a series of numbers and can be referred as a Central Value of these numbers. The Mean can be determined by finding either the Simple Average or a Weighted Average of a series of numbers.
In Statistics and Probability Theory, Standard Deviation is usually represented by the symbol of Sigma, σ. Standard Deviation shows the Variation from the Mean. A low Standard Deviation indicates that the observations (series of numbers) are very close to the Mean. A high standard deviation indicates that the observations (series of numbers) are spread out over a large range.
For example, lest us consider the following two series:
Series A: (5, 6, 7)
Series B: (2, 6, 10)
The mean (simple average) of both the series is 6. However, numbers in the series B are far apart as compared to Series A.
We say variation or the standard deviation of Series B is higher than that of Series A.
Mean in PERT Formula
PERT formula is one of the ways to do three point estimation. It is used to calculate weighted mean (average) of three different estimated values.
Note: PERT formula provides a close approximation by using probability distribution technique called Beta Distribution. You can also use Triangular Distribution to calculate the mean and Standard Deviation. You can refer to my other article on three point estimation formulas to do so.
Let us use mean that was determined by using the PERT formulas and correlate it with the Standard Deviation.
How to Use Standard Deviation in Project Management?
Let us go back to the problem statement from our example – how much time would be required to go from point A to point B.
Let us assume two things to understand the concept of standard deviation and variation from the mean.
- We have estimated Optimistic, Most Likely, and Pessimistic duration for going from point A to B.
- There was a a previous project, in which we made ‘n’ trips from point A to point B. We have the records from that project. The records include actual time duration of each trip. The time duration for each trip is different. Let us call them observations.
We can mathematically determine that each observation (duration of a trip from the previous project) is likely to be between our estimated Optimistic and Pessimistic values. Furthermore, maximum number of observations would be near to the Mean but there would be a few observations that are near Optimistic and Pessimistic values. Or, we say that Population Density would be higher near the Mean and it will taper off towards the Optimistic and Pessimistic values.
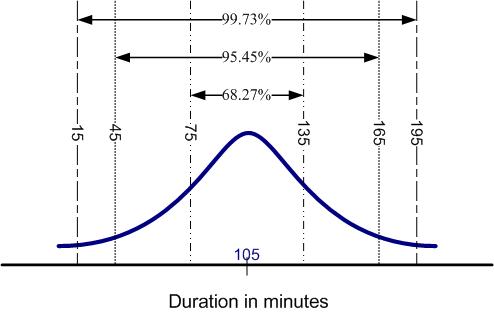
We can plot a graph for these ‘n’ Observation. The Population Density of these Observations would look like a Bell Curve. Bell Curve for our example is shown in following figure. The X-axis shows Duration in minutes and the Y-axis shows Population Density. We can depict Population Density as “number of trips” or “percentage of trips”. The following figure shows percentage of trips.
The above figure depicts a Normal Distribution curve. Normal Distribution is a special case of Beta Distribution. Beta Distribution is skewed towards one side. Although Beta Distribution is slightly skewed to one side, Normal Distribution provides a decent proxy for the Beta Distribution.
There are three important things that can be noticed from the above graph:
- Population Density is highest near the Mean, which means a trip is likely to be completed in approximately 105 minutes.
- Almost all trips are completed within 195 minutes.
- It is unlikely that a trip’s duration will be below 15 minutes.
Range of Estimate
Following discussion assumes data points are Normally Distributed.
Going back to our example, let us assume that if we have to make 1 more trip from point A to point B. Someone asked us what would be the duration estimate for such a trip.
To answer this, we can provide either single estimate or a range of values. A good single estimate could be 105 minutes since Population Density is maximum near 105 minutes.
However, our next trip could be easily take more or less than 105 minutes. To be on the safe side, it is better to give a range of values for providing an estimate.
We can use Standard Deviation to determine the range. We can say that duration estimate for one more trip is likely to be in the range of 105±30 minutes. In other words, we can say that the trip would take anywhere between 75 minutes to 135 minutes.
Essentially, by suggesting a range, we are increasing our chances for finishing the trip within the promised duration.
Probability and Range of Estimate
We can also determine the probability of completing the trip within 105±30 minutes.
According to the statistical theory, there is a 68.27% Probability of completing the trip within 105±30 minutes.
Let us answer why did we take the probability as 68.27%. We can use the following formula to determine the range of the duration:
R => E_PERT ± (n * σ)
where n is the σ level that the project team wants to use e.g. 1, 2, 3…
The Range R is dependent on ‘n’. As ‘n’ increases, the span of range also increases and it becomes more deterministic to complete the task in the calculated range.
Generally, The value of ‘n’ is governed by the organizational guidelines but under special circumstances, it can be be chosen by the project team.
Usually, the project team chooses a σ level for which it feels confident. That is why ‘n’ is also called Confidence Level.
Using the Probability Distribution theory, we can determine the probability associated with a range. Following list provides probability for different values of ‘n’.
- If n=1 then probability is 68.27%
- If n=2 then probability is 95.45%
- If n=3 then probability is 99.73%
- If n=4 then probability is 99.994%
- If n=3 then probability is 99.99994%
- If n=6 then probability is 99.999999%
Calculating Standard Deviation in Our Example
- There is a 68.27% probability of completing the trip in the range of 105 ± 1*30
- There is a 95.45% probability of completing the trip in the range of 105 ± 2*30
- There is a 99.73% probability of completing the trip in the range of 105 ± 3*30
- …
Over To You
By now, you would have understood how to determine probability of finishing a project task within a specific duration. But, do you know how to determine the probability of completing a whole project?
To find answer to this question, you should read my article on How To Use PERT, CPM & Standard Deviation Together?
Many people believe Probability and Standard Deviation is just a good mathematical stuff. There is hardly any use of them in the real world but this is not true. Statistical analysis has many industrial applications. Standard Deviation is very useful in practical scenarios.
You can also read the following article to gain some more insight – A project is scheduled to FAIL.
What are your thoughts on this topic? Do you think you will be able to solve PMP questions after reading this article? Would you try to implement this concept in your project schedule?
PMP Exam Formulas
I have also compiled a PMP Formulas Cheat Sheet. It contains 45 formulas and 57 abbrviations. It will help you in your exam prep. It is the best and most comprehensive cheat sheet based on the PMBOK Guide 6th edition. You can download it free of cost for your studies.
If you are looking beyond a cheat sheet, then I would suggest you to buy detailed PMP Exam Formula Study Guide by Cornelius Fichtner. It contains detailed explanations of all the formulas along with examples and 105 practice questions.
Disclosure: This article contains affiliate links - it means that, if you buy from any of these links, then I will receive a small commission that would help me in maintaining this blog for free. However, for you, there is no extra cost. I recommend only those products that I believe will definitely help the certification aspirants.


![Finish to Start [FS] Relationship (Dependency) With Examples](https://www.pmbypm.com/wp-content/uploads/2014/06/finish-to-start.jpg)


Thanks, this article was really helpful.
Thanks Jake.
Very well written and clear. Thanks for sharing.
Thanks Petros.
This was a good explanation of how to apply the statistical concepts to PM area, thank you.
Great Article – thank you very much for posting it!
Thanks Roxana
I had a discussion with a statistician about this formula sigma = (P -O)/6. He said that was not recognized way to calculate standard deviation from the mean. I would believe that to be true for small data sets, even with a normal distribution assumption. I understand that this formula is very helpful to bracket a duration of a task, and thereby assist with giving the PM a red flag to sound the alarm in a project, but is this a standard statistical method or a practical formula for calculating a range? What research/proof do I share with statisticians about the validity of this formula?
Thanks.
Hi Jon, Thanks for your comment. Your statistician friend is right. As mentioned in the post, formula for both mean and SD are close approximations. For a detailed exposition on beta distribution, you can look at its wikipedia page – https://en.wikipedia.org/wiki/Beta_distribution
BR
Praveen.
I really liked the article and felt it was helpful. However, I can not figure out how to calculate the % for Probability.
What are the steps to calculate R=105 +/- (n*Q)?
Thank you
Hi Elizabeth, Just choose your confidence level and calculate the range e.g. if your confidence level is 99.45% then you should put n as 2 in the formula.