Earned Value Analysis (EVA) or Earned Value Management(EVM) is a project management technique that combines scope, schedule, and cost to measure project progress and performance.
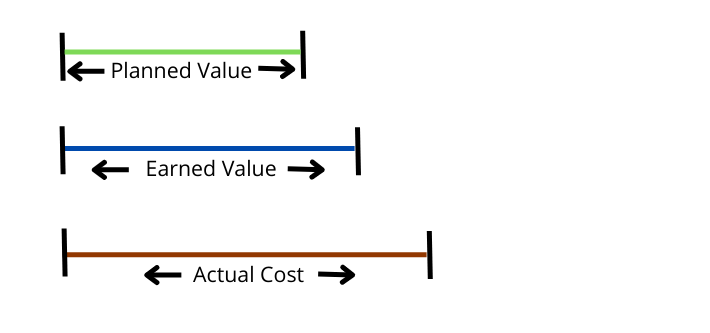
The earned value system uses three basic values for measuring the current performance viz. Planned Value (PV), Earned Value (EV), and Actual Cost (AC). In addition, it also uses Budget At Completion (BAC) for making future projections (forecasting).
Let us understand these terms with the help of a small example. Let us also look at EVM definitions and formulas.
Earned Value Management
Why is EVM Important in Project Management?
EVM is important because it provides a singular view of scope, schedule, and cost. Rather than measuring and reporting schedule and cost performance separately, EVM measures everything in terms of money or its monetary equivalent.
Let me ask you this question – do you understand the language of money?
Well! Who doesn’t?
The basic principle of Earned Value (EV) stems from the fact that everyone understands the language of money. The concept of money is ingrained into us right from our childhood and that is why EVM measures everything in terms of money.
Earned Value Management (EVMS) is used extensively in the government contracts. Here is a quote from U.S. Department of Energy.
The U.S. Department of Energy (DOE) uses Earned Value Management (EVM) as a performance management tool that measures actual performance of work scope and the associated cost and schedule compared to the approved baseline plan for a project or contract.
You can also look at the following videos to understand what EVM is and why it is required.
Let us look at the basic terms of EVM to understand the equivalence between Scope, Schedule, and Cost, .
1. Planned Value (PV)
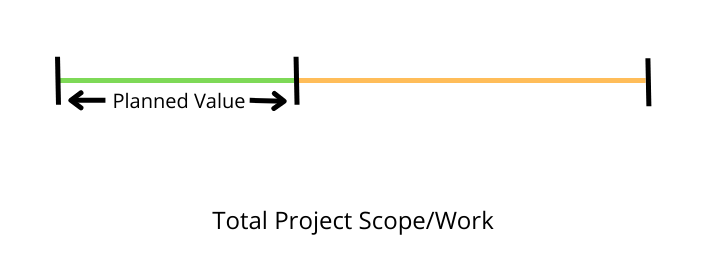
PV is the monetary value of the work that was planned to be completed in a specified period.
It is also known as Budgeted Cost of Work Scheduled (BCWS).
You can look at Max Wideman Glossary for more definitions.
For example, if I wanted to make 4 widgets in a specified period of time and if each widget is estimated to cost $10 then I can say that my PV is $40 (4 X $10).
2. Earned Value (EV)
EV is the monetary value of the completed work in a specified period.
It is also known as Budgeted Cost of Work Performed (BCWP).
You can look at Max Wideman Glossary for more definitions.
For example, if I have made 5 widgets in a specified period of time and if each widget was estimated to cost $10 then I can say that my EV is $50 (5 X $10).
3. Actual Cost (AC)
AC is the actual expenditure during a specified period.
It is also known as Actual Cost of Work Performed (ACWP).
You can look at Max Wideman Glossary for more definitions.
For example, if I incurred an expense of $60 during a specified period of time then I can say that my AC is $60.
4. Budget At Completion (BAC)
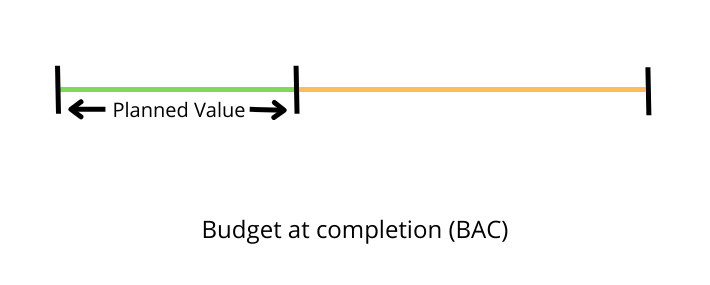
BAC is the total authorized budget for a project.
You can look at Max Wideman Glossary for more definitions.
For example, if I have been tasked with a project for making 100 widgets and if each widget is estimated to cost $10 then I can say that my project’s BAC is $1000 (100 X $10).
You can also look at the following video to understand PV, EV, AC, and BAC.
Earned Value Analysis Example
Let us consider that we have to complete a small project. We need to build wooden tables.
Project Plan
The project team needs to build 80 wooden tables in 5 days. It is estimated that each table will cost 1000 units of money.
The following figure provides initial plan for the project. It also provides equivalence between Project Scope, Schedule, and Cost.
| Project Scope | Build 80 tables |
| Project Schedule Estimate | 5 Days |
| Cost Estimate per Table | 1000 units of money |
| Project Cost Estimate | 80000 units of money |
The following figure provides detailed Schedule and Cost estimates at the start of the project.
| Day 1 | Day 2 | Day 3 | Day 4 | Day 5 | |
|---|---|---|---|---|---|
| Tables Planned to be Built | 10 | 13 | 17 | 20 | 20 |
| Estimated Cost for the Day | 10000 | 13000 | 17000 | 20000 | 20000 |
| Estimated Cumulative Cost | 10000 | 23000 | 40000 | 60000 | 80000 |
Project Tracking
Let us assume that, the project was started 3 days ago and we are evaluating the performance at the end of Day 3.
The following figure provides status at the end of Day 3. There are two new rows that depict the progress of the project. These are shown in light orange background.
| Day 1 | Day 2 | Day 3 | Day 4 | Day 5 | |
|---|---|---|---|---|---|
| Tables Planned to be Built | 10 | 13 | 17 | 20 | 20 |
| Estimated Cost for the Day | 10000 | 13000 | 17000 | 20000 | 20000 |
| Estimated Cumulative Cost | 10000 | 23000 | 40000 | 60000 | 80000 |
| Actual Cost for the Day | 8000 | 12000 | 16000 | ||
| Actual Cumulative Cost | 8000 | 20000 | 36000 |
Cumulative Work Scheduled at the end of Day 3 = 40 Tables
EVA considers monetary value of the work. So, we can re-write the above statement as
Cumulative Work Scheduled at the end of Day 3 = 40 Tables worth 40000 units of money
Cumulative Actual Cost at the end of Day 3 = 36000 units of money
Is the Project Team making good progress?
Some of you might say that project has saved cost. The team has spent 36000 units of money against an estimate of 40000 units.
Some others might say that project is behind. The team has build only 36 tables instead of planned 40.
Both are incorrect interpretation of the given data. The data, itself, is incomplete.
Do you know how much work has been completed? How many tables were built at the end of Day 3?
No.
We need another parameter to determine the progress of the project. Let us introduce some more data in the above figure.
Introducing Earned Value
| Day 1 | Day 2 | Day 3 | Day 4 | Day 5 | |
|---|---|---|---|---|---|
| Tables Planned to be Built | 10 | 13 | 17 | 20 | 20 |
| Estimated Cost for the Day | 10000 | 13000 | 17000 | 20000 | 20000 |
| Estimated Cumulative Cost | 10000 | 23000 | 40000 | 60000 | 80000 |
| Tables Actually Built | 8 | 12 | 15 | ||
| Value of Tables Actually Built | 8000 | 12000 | 15000 | ||
| Cumulative Value of Tables Actually Built | 8000 | 20000 | 35000 | ||
| Actual Cost for the Day | 8000 | 12000 | 16000 | ||
| Actual Cumulative Cost | 8000 | 20000 | 36000 |
You would have noticed that only 35 tables were built at the end of the day 3.
Cumulative Work Scheduled at the end of Day 3 = 40 Tables worth 40000 units of money
Cumulative Actual Cost at the end of Day 3 = 36000 units of money
Cumulative Work Performed at the end of Day 3 = 35 tables worth 35000 units of money at the Budgeted Cost
Let us re-write these terms again
Budgeted Cost of Work Scheduled (BCWS) = 40000
Budgeted Cost of Work Performed (BCWP) = 35000
Actual Cost of Work Performed (ACWP) = 36000
These are the 3 basic terms/values of EVA. The modern names for these terms are Planned Value (PV), Earned Value (EV) and Actual Cost (AC) respectively.
Earned Value Analysis Formulas and Calculations
We can interpret a few things by analyzing the above data.
1. The project is behind schedule.
- The Project Team had planned to build 40 tables at the end of Day 3.
- They could only build 35 tables.
- In EVA parlance we can say that Project Team planned to complete the work that was worth 40000 units of money.
- They completed the work that was worth 35000 units of money.
2. The project is Over Budget.
- The Project Team build 35 tables at the end of Day 3.
- In EVA parlance we can say that they completed the work that was worth 35000 units of money.
- The Project Team spent 36000 units of money to build 35 tables.
- In EVA parlance we can say that 36000 units of money was spent for doing the work that was worth 35000 units of money.
Let us write initial formulas based on above interpretations.
Variance Formulas
Schedule Variance (SV) = EV – PV
Cost Variance (CV) = EV – AC
Efficiency Formulas
Schedule Performance Index (SPI) = EV/PV
Cost Performance Index (CPI) = EV/AC
You can also look at the following video to understand Variances and Efficiencies.
Calculations
SV = 35000 – 40000 = -5000
CV = 35000 – 36000 = -1000
SPI = 35000 / 40000 = 0.875
CPI = 35000 / 36000 = 0.97
You can refer to my other article for a complete list of EVM formulas.
Final Thoughts
- EV is the first term in all the formulas.
- Negative variance means Project is behind.
- Positive variance means Project is ahead.
- Efficiency less than 1 means Project is behind.
- Efficiency of greater than 1 means Project is ahead.
Over To You
EVM is considered to be one of the more difficult concepts of Project Management. Many practicing professionals find the earned value terms and definitions confusing. They somehow dread formulas and calculations. I believe is much simpler concept than it is made out to be.
In this article, I have explained EVA by using a small example. In another post, I have provided its explanation in simple and easy language. You should read both these articles to understand the concept completely.
Do you know why most professionals find Earned Value (EV) confusing?
I believe PMP prep books and training programs should be blamed for the state of confusion. They have just over-complicated an easy concept. They stress more on formulas and calculations without explaining the basic concepts.
Let me be honest here. My first experience with EVA was on similar lines. I did not find the concept intuitive during the initial days of my PMP exam prep.
Even though my first experience was not pleasant, I persevered. I re-read the concepts and understood with the help of examples. After, I understood the topic, Earned Value Management seemed like a walk in the park.
Do you still have any confusion about earned value analysis? Can you apply formulas and do earned value calculations at the end of Day 2?
Please leave a comment.
EVM Formulas And Their Explanations
Simple Definitions And Explantions Of EVM
PMP Exam Formulas
I have also compiled a PMP Formulas Cheat Sheet. It contains 45 formulas and 57 abbrviations. It will help you in your exam prep. It is the best and most comprehensive cheat sheet based on the PMBOK Guide 6th edition. You can download it free of cost for your studies.
If you are looking beyond a cheat sheet, then I would suggest you to buy detailed PMP Exam Formula Study Guide by Cornelius Fichtner. It contains detailed explanations of all the formulas along with examples and 105 practice questions.
Disclosure: This article contains affiliate links - it means that, if you buy from any of these links, then I will receive a small commission that would help me in maintaining this blog for free. However, for you, there is no extra cost. I recommend only those products that I believe will definitely help the certification aspirants.





This example is really very helpful for all PMP aspirants.
And that couldn’t be more accurate right here. Having said that, allow me say to you exactly what did work. Your article (parts of it) is certainly rather powerful which is possibly the reason why I am taking an effort to comment.
There is a little error here. You considered figures of 3rd day’s work only. But what should be considered is work done till end of day3., ie work completed and cost incurred on day1+day2+day3. In this case ,
BCWS (PV) = 10+13+17=40 tables; 40000 units of money
BCWP(EV) = 8+13+15=36 tables; 36000 units of money
ACWP (AC) = 8+12+16=36000 units of work
SV = EV-PV = 36-40 = -4 Behind Schedule
CV = EV-AC = 36-36 = 0 On Budget
EV is always the actual earn. If you look at the 3rd table, it clearly says that 35 tables only been built by EOD of 3rd day, which in dollar value is 35000.
But AC is actual spent, so AC = 36K
What was originally planned is 40K, so PV = 40K.
Hope, it is clear now.
Thanks Soumyo
Hi Sanjeev, Only cumulative values are considered i.e total till the end of Day 3. Where is the confusion?
BR, Praveen.
Clears a lot of my doubts… And I now know where should I check when I have any confusion 🙂
Good explanation but small arithmetic error in the results. SV = 35000 – 40000 = -5000 and not -4000 as stated in the article.
Thanks Jonathan. I have corrected it.
Found one small, but significant, typo under “Variance Formulas”…
Your article states “Cost Variance (SV) = EV – AC”.
The acronym for Cost Variance should be CV.
Other than that, GREAT article. Thanks!!
Thanks Regis, Corrected it.
Wonderfully explained. Thank you sir.
I truly appreciate your excellent effort to teach nicely and easy way.
Thanks Roman
One of the biggest benefits of using task management software is the ability to seamlessly collaborate across your organization as well as with external collaborators such as clients, vendors, and stakeholders.
Thank you Sir, it is very helpful ..
A big thank you. Am writing my exam today and i was so confused with these terms and the calculation. Bravo.
what if the case is not given about the actual tables built ,
in your case when i watch the video- the question says that at the end of day 3- 35 were bulit.
but i want to know about a case were , only actual cost is given and not the actual tables, in that case will the PV be 36000?
If that is the case, you will not be able to calculate EV.